
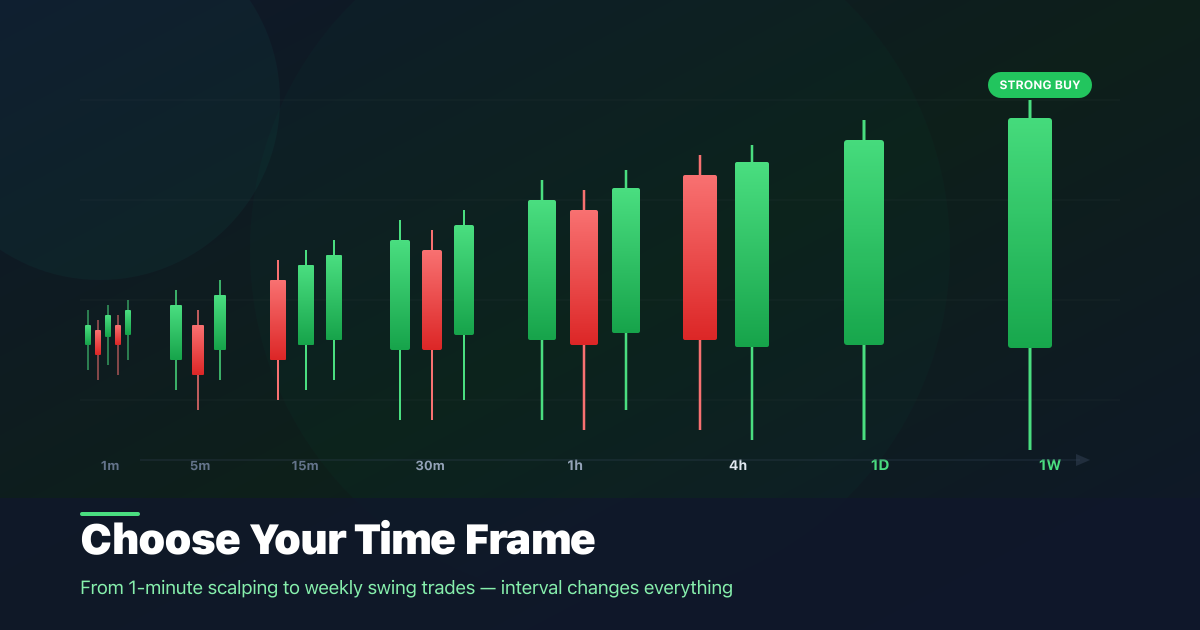
Choosing the Right Interval: A Guide to Time Frames
From 1-minute scalping to weekly swing trades — the interval you choose changes everything about how signals look. Here's how to pick the right time frame for your research style.
What Is a Time Interval?
Every technical indicator is calculated over a sequence of price bars — and each bar represents a fixed period of time called the interval. A 1-hour chart uses bars where each candle represents one hour of price movement. A daily chart uses bars where each candle represents one full trading day.
The interval you choose fundamentally changes what the indicators tell you. A 1-hour RSI tells you about momentum over the past few hours. A weekly RSI tells you about momentum over the past several weeks. Same formula, very different picture.
Available Intervals on Noiseless Signals
Interval Typical Use Signal Frequency 1 minScalpingVery high — very noisy 5 minShort-term day tradingHigh 15 minDay tradingModerate–High 30 minDay / swing tradingModerate 1 hourSwing tradingModerate 4 hourSwing tradingLower DailyPosition tradingLow — more reliable WeeklyLong-term researchVery low — high confidenceShort Intervals: More Signals, More Noise
The 1-minute and 5-minute intervals generate signals very frequently. This can be useful for identifying very short-term entry and exit points, but signals are heavily influenced by random short-term price fluctuations. Expect more false positives and reversals.
Long Intervals: Fewer Signals, Higher Confidence
Daily and weekly signals fire much less frequently, but when they do, they reflect sustained momentum and meaningful trend changes rather than short-term noise. These are generally considered more reliable for educational research purposes.
Which Interval Should You Use?
There's no universal answer — it depends entirely on the time horizon you're researching and how actively you want to monitor. A common approach is to use a higher interval (daily or 4h) to establish the broader trend direction, then a lower interval (1h or 15m) to look for more precise timing signals within that trend.
On Noiseless Signals you can view signals across all intervals for any asset and set alerts on whichever interval matters most to your research. Try different intervals on the same asset and see how the signals compare.
All signals are for educational and research purposes only. This is not financial advice.