
Understanding Technical Indicators: RSI, EMA, and Bollinger Bands
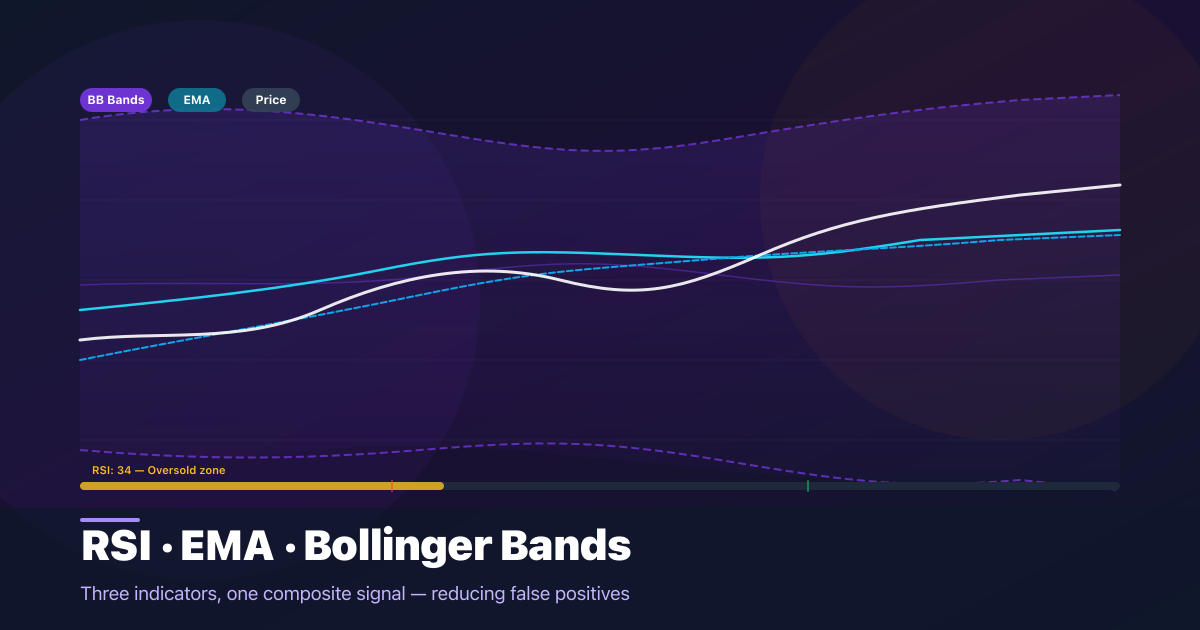
Our signals are powered by three proven technical indicators. Here's what each one measures, how they work, and why combining them leads to more reliable signals.
Why Three Indicators?
No single indicator is perfect. Each measures a different aspect of price behaviour — momentum, trend, and volatility. By combining RSI, EMA, and Bollinger Bands, our algorithm looks at the full picture before generating a signal, which reduces false positives compared to relying on any one indicator alone.
RSI — Relative Strength Index
RSI measures the speed and magnitude of recent price changes to evaluate whether an asset is overbought or oversold on a scale from 0 to 100.
- Above 70 — Potentially overbought. May be due for a pullback.
- Below 30 — Potentially oversold. May present a buying opportunity.
- Between 30–70 — Neutral territory.
RSI is a momentum oscillator — it tells you how fast price has been moving. It's most powerful when used to confirm signals from trend-based indicators.
EMA — Exponential Moving Average
EMA is a moving average that gives more weight to recent prices, making it more responsive to current market conditions than a simple moving average.
We use multiple EMA periods to identify trend direction and potential reversal points.
- Price above EMA — Uptrend in place. Bullish bias.
- Price below EMA — Downtrend in place. Bearish bias.
- Short EMA crosses above long EMA — Potential bullish trend change (golden cross).
- Short EMA crosses below long EMA — Potential bearish trend change (death cross).
Bollinger Bands
Bollinger Bands consist of a middle band (SMA) with two outer bands set at standard deviations above and below it. They visually represent volatility — expanding during volatile periods and contracting during quiet ones.
- Price near or above upper band — Potentially overbought, or in a strong uptrend breakout.
- Price near or below lower band — Potentially oversold, or in a strong downtrend.
- Band squeeze (bands narrow) — Low volatility period, often preceding a strong directional move.
How We Combine Them
Our algorithm scores each indicator and combines them into a composite signal. When all three align — RSI showing oversold, price below EMAs, and touching the lower Bollinger Band — that produces our strongest Strong Buy signal. Partial alignment produces Buy or Sell. No clear alignment produces Neutral.
All signals are for educational and research purposes only. This is not financial advice and past performance does not guarantee future results.